Every revenue plan starts with an assumption. Most of those assumptions are wrong — not because the people making them are careless, but because they’re borrowing benchmarks without understanding the physics underneath them.
This report exists to fix that. It’s a comprehensive reference for the conversion rates, cycle times, unit economics, and operating ratios that govern B2B SaaS go-to-market performance in 2026. But here’s what matters more than any number on this page: context determines whether a benchmark is a useful signal or a dangerous distraction.
A 20% opportunity-to-close rate is outstanding at a Series A company selling $100K enterprise deals into a new category. It’s mediocre for a Series C company with a known brand selling $15K SMB contracts through a product-led motion. Same number, completely different diagnosis. If you haven’t read the piece on stage-appropriate metrics, start there. The benchmarks below are the raw material. Your company’s physics — its mass, velocity, and distance — determines what they mean.
Use this report to pressure-test your assumptions, not to copy someone else’s. And if you want to run your specific numbers through the math, the B2B Funnel Velocity Calculator will tell you in five minutes whether your plan reconciles.
Funnel Conversion Rates by Stage
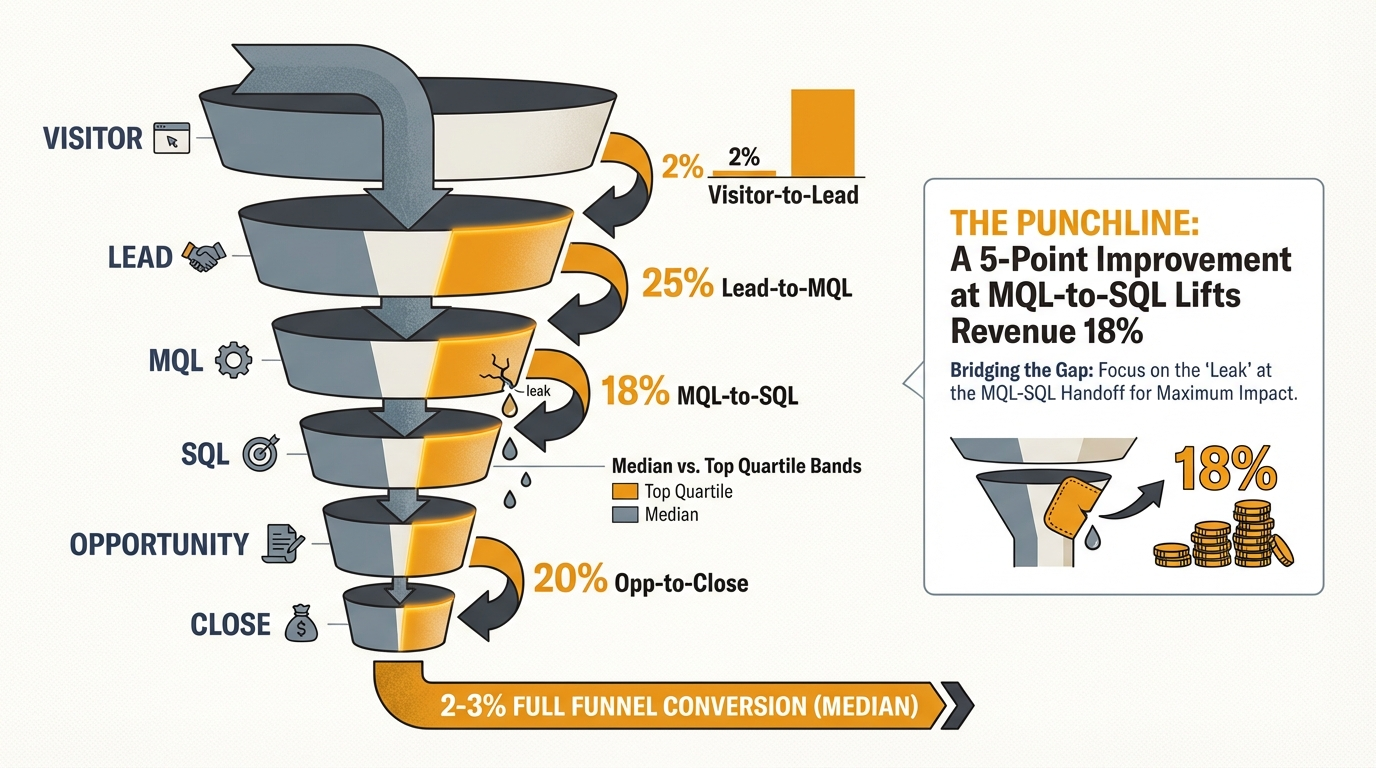
This is the chain that connects marketing activity to closed revenue. Every conversion point is a place where friction compounds — and a 5-point improvement at the MQL-to-SQL stage can lift revenue by up to 18% (Causal Funnel, 2026).
Overall B2B SaaS Funnel Benchmarks
| Funnel Stage | Median | Top Quartile | Bottom Quartile |
|---|---|---|---|
| Visitor → Lead | 1.5–2.5% | 8–15% | < 0.7% |
| Lead → MQL | 25–35% | 40%+ | < 15% |
| MQL → SQL | 15–21% | 30–40% | < 10% |
| SQL → Opportunity | 40–60% | 65%+ | < 30% |
| Opportunity → Close | 15–25% | 30%+ | < 12% |
| Full Funnel: Lead → Close | 2–3% | 5%+ | < 1% |
Sources: First Page Sage 2026 Report, Artisan Strategies (1,200+ companies), Prospeo 2026 Benchmarks
Conversion Rates by Company Size
| Funnel Stage | SMB (< $15K ACV) | Mid-Market ($15K–$100K) | Enterprise (> $100K) |
|---|---|---|---|
| Visitor → Lead | 2.5–4% | 1.5–2.5% | 0.8–1.5% |
| MQL → SQL | 20–30% | 15–25% | 10–18% |
| Opportunity → Close | 30–39% | 20–28% | 15–22% |
Conversion Rates by Lead Source
| Source | Visitor → Lead | Opportunity → Close |
|---|---|---|
| Organic Search (SEO) | 2.6–2.7% | 25–30% |
| Referral | 2.9% | 35–40% |
| Webinars | 0.9% | 40% |
| Paid Search (PPC) | 0.7% | 15–20% |
| Outbound/Cold | N/A | 10–15% |
Sources: SaaS Hero 2026 CRO Framework, Pixelswithin Revenue Gap Analysis
What This Means
The MQL-to-SQL handoff remains the biggest value-destruction point in most funnels. If your rate is below 15%, the problem is almost always one of two things: your lead scoring is broken (marketing is calling things “qualified” that sales would never touch), or your handoff process is creating delay that kills momentum. Neither is a budget problem — both are system friction problems.
Also note the gap between organic/referral and paid sources at the close stage. Organic and referral leads close at nearly 2x the rate of paid leads. This isn’t surprising — they arrive with more intent and more trust — but most companies allocate budget in the inverse proportion. That’s the kind of disconnect the funnel math makes visible before you spend the dollar.
So what: If you’re a Series A company with conversion rates in the bottom quartile, you don’t have a pipeline volume problem — you have a friction problem. Fix the system before you pour more leads into a leaking funnel. If you’re Series B+ and your organic close rates aren’t meaningfully outperforming paid, your content engine isn’t building the mass it should be.
Sales Cycle Length by ACV
Cycle length is the single most underestimated variable in revenue planning. Most annual plans assume uniform pipeline contribution across 12 months and ignore the fact that cycle time determines your effective pipeline generation window.
| ACV Tier | Median Cycle (Days) | Range | Key Driver |
|---|---|---|---|
| < $10K | 14–30 | 7–45 | Self-serve / low-touch |
| $10K–$25K | 30–60 | 21–75 | 1–2 decision makers |
| $25K–$50K | 60–90 | 45–120 | Procurement involvement |
| $50K–$100K | 90–120 | 60–180 | Committee buying, security review |
| $100K+ | 120–180+ | 90–365 | Multi-stakeholder, legal, compliance |
Sources: Optifai Sales Cycle Benchmark, punchDev State of B2B SaaS Sales 2026, Prospeo SaaS Sales Cycle
Recent Trends
Cycles are getting longer, not shorter:
- Average B2B SaaS cycle hit 134 days in 2025 — up 25% from 107 days in 2022.
- Average deal now involves 6.8 stakeholders (up from 5.4 in 2020).
- Security reviews, legal redlines, and compliance questionnaires add an average of 16 days even for mid-market deals.
Source: Hyperbound 2025 B2B Sales Performance Report
What This Means
If you’re planning for $3M in new ARR this year with a 120-day cycle, your effective pipeline generation window closed in early September — not December. Every campaign you launch after that is building next year’s number. Most revenue plans completely ignore this time lag, which is how the math kills the deal before the deal is a lead.
So what: Take your current sales cycle, add 20% for optimism bias, and back-calculate your real pipeline deadline. If that deadline has already passed for this year’s number, you need to adjust the target or get honest with the board. The calculator automates this math.
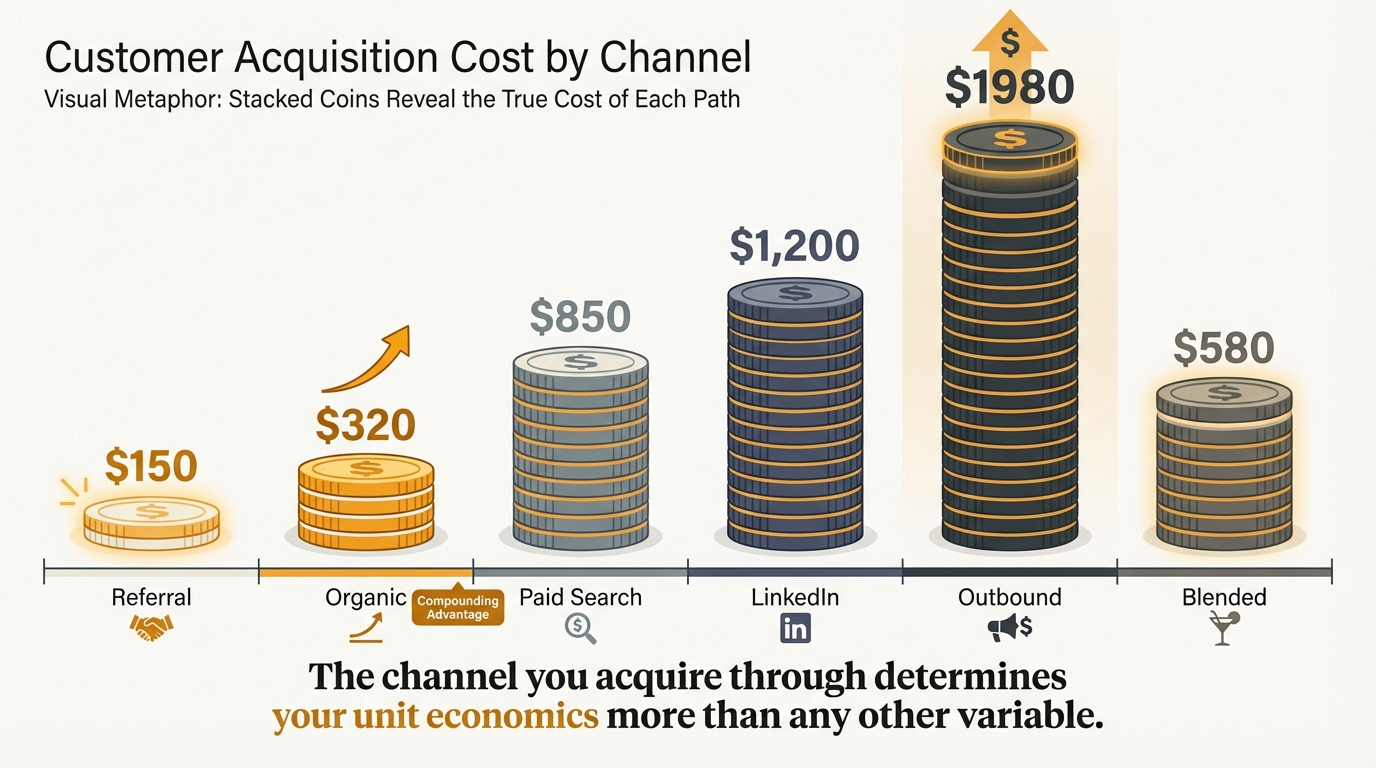
Customer Acquisition Cost (CAC) by Channel
CAC has risen 40–60% since 2023 across B2B SaaS. The era of cheap digital acquisition is over. What matters now is not just cost per customer, but cost per retained customer — and the channel mix that produces the best unit economics.
| Channel | Average CAC | Trend | Notes |
|---|---|---|---|
| Referrals | $150 | Stable | Most cost-efficient; hardest to scale |
| Organic Search (SEO/Content) | $480–$940 | Declining over time | Compounds — drops to ~$290 as content matures |
| Paid Social (Meta) | $230 | Rising | Privacy changes reducing efficiency |
| Paid Search (Google) | $800 | Rising | Competition + rising CPCs |
| Paid Social (LinkedIn) | $980 | Rising | Premium audience, premium price |
| Events/Conferences | $1,200–$1,800 | Stable | High cost, high intent |
| Outbound Sales (SDR) | $1,980 | Rising | Effective for $50K+ deals |
Overall B2B SaaS average CAC: $1,200 across all channels combined.
Sources: First Page Sage CAC Report, Phoenix Strategy Group CAC by Channel, Genesys Growth CAC Benchmarks
CAC by Company Stage
| Stage | Median CAC | $ to Acquire $1 of New ARR | Context |
|---|---|---|---|
| Seed | $1,500–$3,000+ | $2.50–$3.00 | Low efficiency is expected; still learning ICP |
| Series A | $1,000–$2,000 | $1.80–$2.50 | Channels narrowing; should see improvement |
| Series B | $800–$1,500 | $1.30–$1.80 | Compounding effects kicking in |
| Series C+ | $500–$1,200 | $0.80–$1.30 | Brand, content, referral flywheel maturing |
Source: Data-Mania CAC Benchmarks for B2B Tech
What This Means
The channel you acquire customers through determines your unit economics more than almost any other variable. A company spending $980 per customer on LinkedIn and $480 on organic content might look at the blended $730 and feel fine — but if 80% of their spend is on LinkedIn and 20% on content, the real economics are much worse than the blend suggests.
So what: If your blended CAC is above $1,500 at Series B, you have a channel mix problem, not a budget problem. Audit where the dollars go. Shift spend toward channels with compounding returns (content, referral programs) and away from channels with linear returns (paid). The Digital Context Audit can help diagnose what’s actually building mass in your system versus just generating activity.
LTV:CAC Ratios by Stage
The ratio that tells you whether your growth is building an asset or burning cash.
| Stage | Target LTV:CAC | CAC Payback Target | What Investors Expect |
|---|---|---|---|
| Seed / Pre-PMF | 2–3:1 acceptable | < 18 months | Tolerance for inefficiency while finding fit |
| Series A | 3:1+ | < 12 months | Proof that unit economics can work |
| Series B | 3–4:1 | < 12 months | Efficient scaling, not just growth |
| Series C+ | 5:1+ | < 8–10 months | Capital efficiency and compounding returns |
CAC payback by segment: SMB < 12 months, Mid-Market < 18 months, Enterprise < 24 months.
Median across all B2B SaaS: 3.2:1 — top quartile companies maintain 4:1 to 6:1.
Sources: SaaS Hero LTV:CAC Benchmarks, Proven SaaS CAC Payback, GrowthSpree LTV:CAC Guide
What This Means
Below 3:1, you’re spending more to acquire customers than the business model can sustain. Above 5:1, you’re probably underinvesting in growth — leaving market share on the table. The sweet spot for growth-stage companies is 3–4:1 with payback under 12 months.
So what: If your LTV:CAC is below 3:1 at Series B, the problem isn’t your marketing budget — it’s either your retention (LTV side) or your channel efficiency (CAC side). Diagnose which before you change the spend.
Pipeline Coverage Ratios
The most commonly cited and most commonly misunderstood metric in B2B revenue planning.
| Segment | Required Coverage | Win Rate Assumption | Notes |
|---|---|---|---|
| SMB / High-Velocity | 2–3x | 30–45% | Shorter cycles, less slippage |
| Mid-Market | 3–4x | 20–28% | Standard B2B motion |
| Enterprise | 4–5x | 12–18% | Long cycles, high slippage |
The “3x pipeline” rule is not universal. It’s an average that obscures massive variance by segment and win rate. If your win rate is 20%, you need 5x coverage to reliably hit quota. If it’s 40%, 2.5x is sufficient.
The critical threshold: reps who start the quarter with 3.2x+ weighted coverage hit quota 89% of the time. Below 2.8x, attainment drops to 52%.
Sources: Landbase Pipeline Coverage Guide, Forecastio Pipeline Coverage, Fullcast Pipeline Ratios
What This Means
Stop using “3x” as a universal target. Calculate your required coverage from your actual win rate and historical slippage. A company that builds 3x coverage against a 15% win rate is planning to miss by 55%. That’s not ambitious — it’s innumerate.
So what: Take your trailing-12-month win rate on qualified pipeline. Divide 1 by that number. Add 20% for deal slippage. That’s your required coverage ratio. If the answer is higher than what your pipeline generation can produce, you’ve found the constraint — and it’s usually a friction problem, not a volume problem.
Win Rates by Deal Size and Source
| ACV Tier | Median Win Rate | Top Quartile | Key Factor |
|---|---|---|---|
| < $10K | 28–35% | 40–45% | Speed and simplicity |
| $10K–$50K | 20–28% | 32–38% | 2–4 stakeholders |
| $50K–$100K | 15–22% | 25–30% | Procurement + legal |
| $100K–$500K | 12–18% | 22–26% | Committee buying |
| $500K+ | 8–15% | 18–22% | 6–18 month cycles, 13+ decision makers |
Overall B2B average: 21% on all opportunities, 29% on qualified pipeline.
Win Rates by Lead Source
| Source | Win Rate | Context |
|---|---|---|
| Inbound / Organic | 25–30% | High intent, pre-educated buyer |
| Referral / Partner | 35–40% | Trust transferred from referrer |
| Outbound / Cold | 10–15% | Lower intent, higher friction |
| Competitive Displacement | 8–12% | Highest friction; switching costs |
Sources: Landbase Win Rate Benchmarks (847 companies), Optifai Win Rate by Deal Size, Salesmotion Win Rate Calculator
What This Means
Win rate degrades predictably with deal size and buying complexity. But source matters just as much as size — a $50K inbound deal closes at nearly 2x the rate of a $50K outbound deal. This is why the compound rate between growth and sales is the most undertracked metric at Series B: if your marketing-sourced pipeline doesn’t convert measurably better than cold outbound, your growth engine isn’t creating leverage.
So what: Track win rates by source and by deal size independently. If your inbound win rate isn’t meaningfully higher than outbound, your content and brand aren’t building the mass you think they are.
Marketing Spend as % of Revenue
| Company Stage | Marketing as % of Revenue | Sales + Marketing Combined | Context |
|---|---|---|---|
| Pre-PMF / Seed | 30–60% | 50–80% | Heavy investment in learning |
| Series A | 20–30% | 40–55% | Scaling what’s working |
| Series B | 15–25% | 35–45% | Balancing growth and efficiency |
| Series C+ | 8–15% | 25–35% | Optimization and leverage |
| Public / Late-Stage | 5–10% | 20–30% | Brand flywheel carrying the load |
PLG companies spend ~13% of revenue on marketing (higher on tooling). SLG companies average ~9% (more balanced between programs and people).
Sources: SaaS Capital 2025 Spending Benchmarks, Data-Mania B2B Marketing Budget Benchmarks, Oliver Munro SaaS Marketing Statistics
What This Means
Marketing spend should decrease as a percentage of revenue as the company scales — not because marketing gets less important, but because brand, content, and customer base create compounding returns that reduce marginal acquisition cost. If your marketing spend percentage isn’t declining from Series A to C, your system isn’t building mass.
So what: If you’re a Series B company spending 25%+ on marketing and your organic/referral pipeline isn’t growing faster than paid, you’re buying growth instead of building it. That’s a physics problem, not a budget problem.
Net Revenue Retention (NRR) by Segment
NRR is the clearest single indicator of product-market depth. Acquisition gets you customers. Retention tells you whether you’ve earned them.
| Segment | Median NRR | Top Quartile | Bottom Quartile |
|---|---|---|---|
| SMB (< $25K ACV) | 97% | 110%+ | < 85% |
| Mid-Market ($25K–$100K) | 108% | 120%+ | < 95% |
| Enterprise (> $100K ACV) | 118% | 130%+ | < 105% |
By Company Size (ARR)
| ARR Range | Median NRR | Median GRR |
|---|---|---|
| $1M–$10M | 98% | 85% |
| $10M–$50M | 106% | 90% |
| $50M–$100M | 112% | 92% |
| $100M+ | 115% | 94% |
Industry median: 106% NRR, 90% GRR. Expansion revenue now accounts for 40–50% of new ARR at top-performing companies.
Sources: Optifai NRR Benchmark (939 companies), McKinsey NRR Advantage, High Alpha NRR 2025
What This Means
Below 100% NRR, your installed base is shrinking every year — you’re running just to stay in place. In SMB, median NRR is already below 100%, which means SMB-focused companies must acquire new logos aggressively just to maintain revenue. Enterprise companies above 115% NRR are literally growing from their existing base without selling a single new deal.
So what: If you’re spending more time and money on acquisition than retention and your NRR is below 105%, you’re building on sand. Every dollar invested in reducing churn and increasing expansion produces returns that compound for years. Every dollar invested in acquisition produces returns that decay with the customer’s contract length.
Sales Team Ramp Time
The hidden cost that most revenue models ignore entirely.
| Role | Segment | Ramp to Productivity | Notes |
|---|---|---|---|
| SDR | SMB | 1–3 months | Fastest ramp; lower complexity |
| SDR | Mid-Market | 3–4 months | More training, longer cycles |
| SDR | Enterprise | 4–6 months | Complex ICP, relationship-driven |
| AE | SMB | 3–4 months | Quick feedback loops |
| AE | Mid-Market | 4–6 months | Need full cycle experience |
| AE | Enterprise | 9–12 months | Must build pipeline + close |
Ramp time is increasing: Average SDR ramp grew 32% from 4.3 months in 2020 to 5.7 months in 2025, driven by more complex buying environments and longer cycles.
Sources: Optifai SDR Productivity Benchmark, SalesSo SDR Ramp Statistics, Hyperbound Sales Performance Report
What This Means
If your enterprise AE takes 9 months to ramp and your average AE tenure is 18 months, you’re getting 9 months of peak performance per hire. If that AE also has a 120-day sales cycle, they’ll close their first self-sourced deal around month 13. Factor attrition, and your “sales team” is really a pipeline of people at various stages of usefulness.
So what: Build ramp time into your capacity model. If you need 10 productive AEs by Q4, you needed to start hiring in Q1 — and you need to plan for 20–30% attrition during ramp. This math is where the planning fallacy lives in most revenue plans.
Content and Organic Performance
| Metric | Median | Top Quartile |
|---|---|---|
| Organic Visitor → Lead | 2.6–2.7% | 5–8% |
| Content-Influenced Pipeline | 40–55% | 65%+ |
| Content Publishing Cadence (high performers) | 12–20 pieces/month | 20+ |
| Organic CAC (mature content engine) | ~$290 | < $200 |
| Organic CAC (first 12 months) | $480–$940 | $350–$500 |
| Time-Decay Attribution: Content Influence | 40–55% of revenue | — |
Sources: The Rank Masters B2B SaaS Content Benchmarks, Pixelswithin Conversion Benchmarks, Digital Bloom Pipeline Benchmarks
What This Means
Last-click attribution dramatically understates content’s contribution to pipeline. When one company shifted from last-click to time-decay attribution, they found organic content and product trial contributed 55% of revenue influence — versus the 30% last-click had credited. This led to a 30% reallocation away from paid search and 20% increase in content investment.
So what: If you’re not running multi-touch attribution, you’re almost certainly undervaluing content and overvaluing paid. The revenue your organic engine produces is invisible to most dashboards — which is why it’s the first budget to get cut and the last one that should be.
How to Use This Report by Stage
Seed / Series A
You don’t have enough data to know your own numbers yet. Use these benchmarks as scenario brackets, not targets. Run the calculator with best-case and worst-case conversion assumptions to find the range of outcomes your plan could produce. Focus on the metrics that actually matter at your stage: signal quality, learning velocity, and sales cycle reality.
Series B
You should have your own data by now. Compare it to these benchmarks to find the gaps. If your conversion rates are below median, that’s a friction problem to diagnose. If your CAC is above median, that’s a channel mix problem to fix. If your NRR is below 100%, that’s a product-market fit problem that no amount of pipeline will solve.
Series C+
These benchmarks are your efficiency check. Your GTM system should be outperforming median across most categories — that’s what the accumulated mass of brand, content, customer base, and market presence is supposed to produce. If it’s not, your system is getting heavier faster than it’s getting stronger, and that’s a structural problem.
The Bottom Line
Benchmarks are useful when they force honest conversation. They’re dangerous when they substitute for understanding your own system.
The conversion rates, cycle times, and unit economics above represent the current state of B2B SaaS in 2026. They’ll shift. What won’t shift is the underlying physics: every GTM system has mass, velocity, and a measurable distance to its revenue target. The companies that understand those dynamics — and measure themselves against stage-appropriate expectations — build engines. The ones that borrow benchmarks without understanding context just build expensive pipeline theater.
If you want to pressure-test your specific numbers, run the calculator. If you want a diagnostic on your GTM system’s actual physics, start with the Digital Context Audit.
This report is part of the Coherence Model framework. Related reading: The Metrics That Turn a Revolving Door Into a GTM Engine, The Math That Kills the Deal Before the Deal Is a Lead, and Why Every GTM Leader You Hire Fails in the Same Way.
Nick Talbert is a growth and GTM executive with 20+ years of experience leading growth at B2B SaaS and technology companies, including roles at companies later acquired by Amazon and AOL. He writes about go-to-market strategy at strategnik.com.