Most early-stage SaaS companies set the same pipeline and revenue targets for their GTM team regardless of whether the company has any market presence, any channel history, or any real data on what the sales cycle actually looks like. Then they’re surprised when the VP of Sales lasts seven months and the head of growth makes it to fourteen.
I wrote about why that pattern is structural, not a talent problem—the system at early stages is too light to produce predictable outcomes, too narrow to give leaders real control, and too early to measure against targets it can’t yet deliver. If you haven’t read that piece, start there. The short version: GTM leader churn correlates with company maturity more than individual capability, and the tenure pattern across growth and sales tracks in lockstep because both functions are fighting the same physics.
This is the practical follow-up. If the tenure problem is structural, the goaling has to be structural too. You can’t set the same expectations for a GTM team operating in a system with almost no market mass and two channels as you would for one with real brand gravity and a dozen compounding motions. The goals need to reflect what’s actually measurable and meaningful at each stage—and what builds toward the next one.
What follows is the framework I’ve refined over twenty years and multiple company stages. It’s organized by funding stage because that’s the proxy most boards and founders use for company maturity, even though the real variable is system mass—how much market presence, channel history, and compounding motion exists in the GTM engine.
Seed and Series A: Measure Signal, Not Pipeline
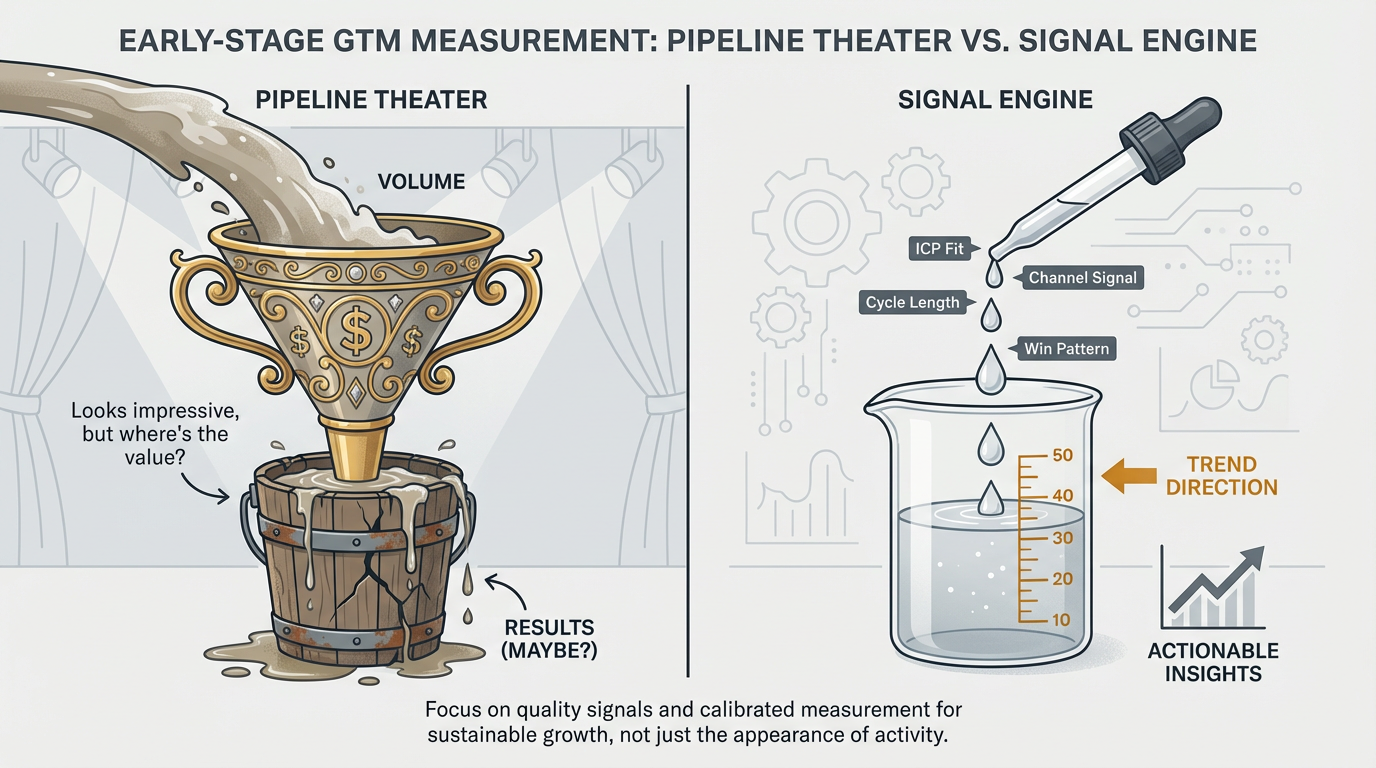
The system doesn’t have enough mass to produce predictable revenue outcomes yet. Pipeline targets set from a fundraising model aren’t goals—they’re hopes. What the GTM team can produce at this stage is something more valuable than early revenue: signal. Which ICPs actually engage? Which ones convert, and at what velocity? Which channels produce real conversations versus noise? What does the actual sales cycle look like—not the one in the pitch deck, but the one in the CRM?
Expect 3–6 months to instrument the basics—CRM hygiene, attribution, lead scoring, ICP definitions—before these metrics produce reliable signal. That tooling-up period isn’t wasted time. It’s the foundation. Trying to measure before the instrumentation exists creates the illusion of data while producing noise.
| Metric | What It Measures | When It Becomes Meaningful |
|---|---|---|
| ICP Signal Quality | % of qualified conversations with target buyers vs. off-ICP conversations | Trackable by month 4–6 |
| Learning Velocity | Time from campaign/channel launch to statistically meaningful signal; should shorten each iteration | Comparable by month 6+ |
| Channel Viability | Number of channels producing real engagement vs. still in test; trend over time | Initial read by month 3–4 |
| Pipeline Trend Direction | MoM acceleration or deceleration of qualified pipeline within target ICP segments (not absolute volume) | Meaningful by month 6+ |
| Sales Cycle Baseline | Actual observed sales cycle length vs. assumed, tracked by ICP segment | Requires 2–3 closed cycles |
| Win/Loss Patterns | Win rate by ICP segment, categorized loss reasons, product-market fit signal from real conversations | Useful at 15–20+ opportunities |
These aren’t soft metrics. They’re the leading indicators that determine whether revenue can happen at scale. A GTM team that delivers clear, improving signal on ICP fit, channel viability, and sales cycle reality in the first year has done the job—even if the absolute pipeline number doesn’t match the board deck. That data is what makes the next phase possible.
What this looks like in practice: Instead of telling your Series A growth leader “generate $2M in pipeline this quarter,” you’re asking “which of our three ICP hypotheses is producing the highest quality conversations, and how fast are we learning which channels reach them?” Instead of telling your VP of Sales “close $500K this quarter,” you’re asking “what does the real sales cycle look like for each segment, and where are we losing deals?” The absolute numbers matter—but at this stage, the trend and the learning rate matter more.
Series B: Measure Compounding, Not Just Growth
The system has gained enough mass to hold a trajectory and enough levers to provide real control. You know your ICPs. You have channels with real conversion history. The sales cycle is documented, not assumed. The goals shift from signal to scale—compounding the motions already at work and improving the machine’s efficiency.
The tooling infrastructure should already be in place from the prior stage. If it isn’t—if a new GTM leader inherits a Series B company with Seed-stage instrumentation—expect 60–90 days to close the gap before these metrics are trustworthy. That’s a red flag worth surfacing in the interview process.
| Metric | What It Measures | Expected Cadence |
|---|---|---|
| Pipeline Volume & Velocity | Qualified pipeline generated and sped through stages, against proven ICP segments | Monthly reporting |
| Stage Conversion Rates | Conversion % at each funnel stage; identifies where the system loses momentum | Monthly reporting |
| CAC Payback | Customer acquisition cost relative to first-year revenue; tracked by segment and channel | Quarterly; stable by Q2–Q3 |
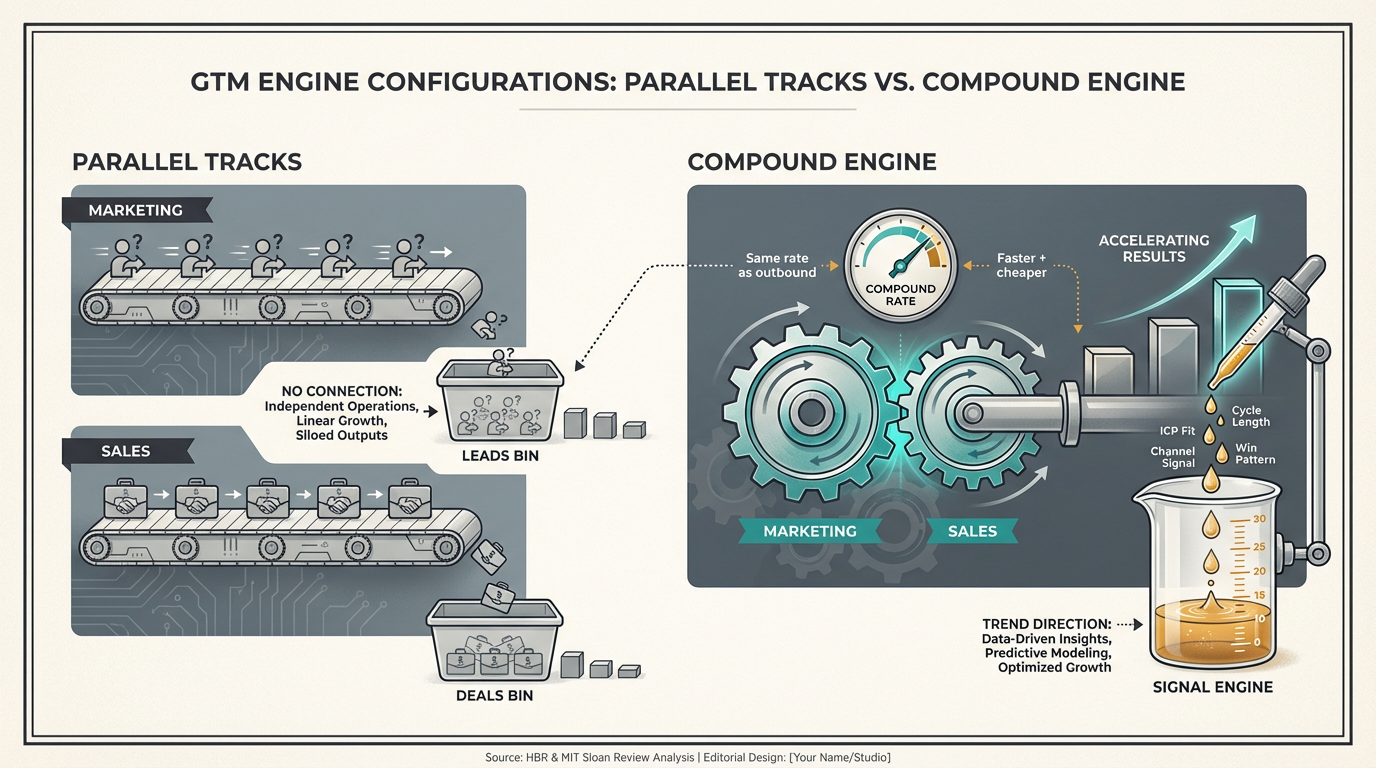
| Growth–Sales Compound Rate | The degree to which growth-sourced pipeline converts at higher rates or shorter cycles than outbound-only | Quarterly comparison |
| Expansion Revenue | Net revenue retention; upsell/cross-sell from installed base as an indicator of product-market depth | Quarterly reporting |
| ICP Penetration | % of total addressable accounts in target segments reached, engaged, or converted | Quarterly; tracks ceiling |
The critical difference between Seed/Series A and Series B isn’t ambition—it’s the relationship between inputs and outputs. At Series B, the system has sufficient mass and levers that the inputs have a known, measurable relationship to the results. Course corrections are adjustments, not pivots.
The metric most teams miss at this stage: Growth–Sales Compound Rate. This measures whether the two functions are actually reinforcing each other or just operating in parallel. If growth-sourced pipeline converts at the same rate and velocity as cold outbound, your growth isn’t creating leverage—it’s just generating leads. The whole point of building growth mass is that it should produce warmer, faster, cheaper pipeline than outbound alone. If it’s not, that’s a system problem worth diagnosing before you scale spend.
Series C and Beyond: Measure Efficiency, Not Just Revenue
By Series C, the GTM system has significant mass. Brand presence is established. Multiple channels are producing at scale. The sales motion is documented and repeatable. The distance to self-sustaining revenue isn’t a mystery—you’re either there or you can see the trajectory clearly. The physics challenge shifts: the system is no longer too light to control. The risk is that it becomes too heavy to move efficiently. Bloated spend, channel fatigue, slowing growth rates masked by absolute revenue numbers, and organizational complexity that creates drag on every motion.
The goal at this stage reflects that shift. The question isn’t “are we building momentum?” or “are we compounding what works?”—it’s “are we extracting maximum return from the mass we’ve built, expanding into adjacent segments, and defending the position we’ve earned?”
Infrastructure should be mature. If a new GTM leader inherits a Series C+ company and the instrumentation still has gaps, that’s a 30–45 day diagnostic and remediation exercise—and it tells you something important about what the previous team prioritized.
| Metric | What It Measures | Expected Cadence |
|---|---|---|
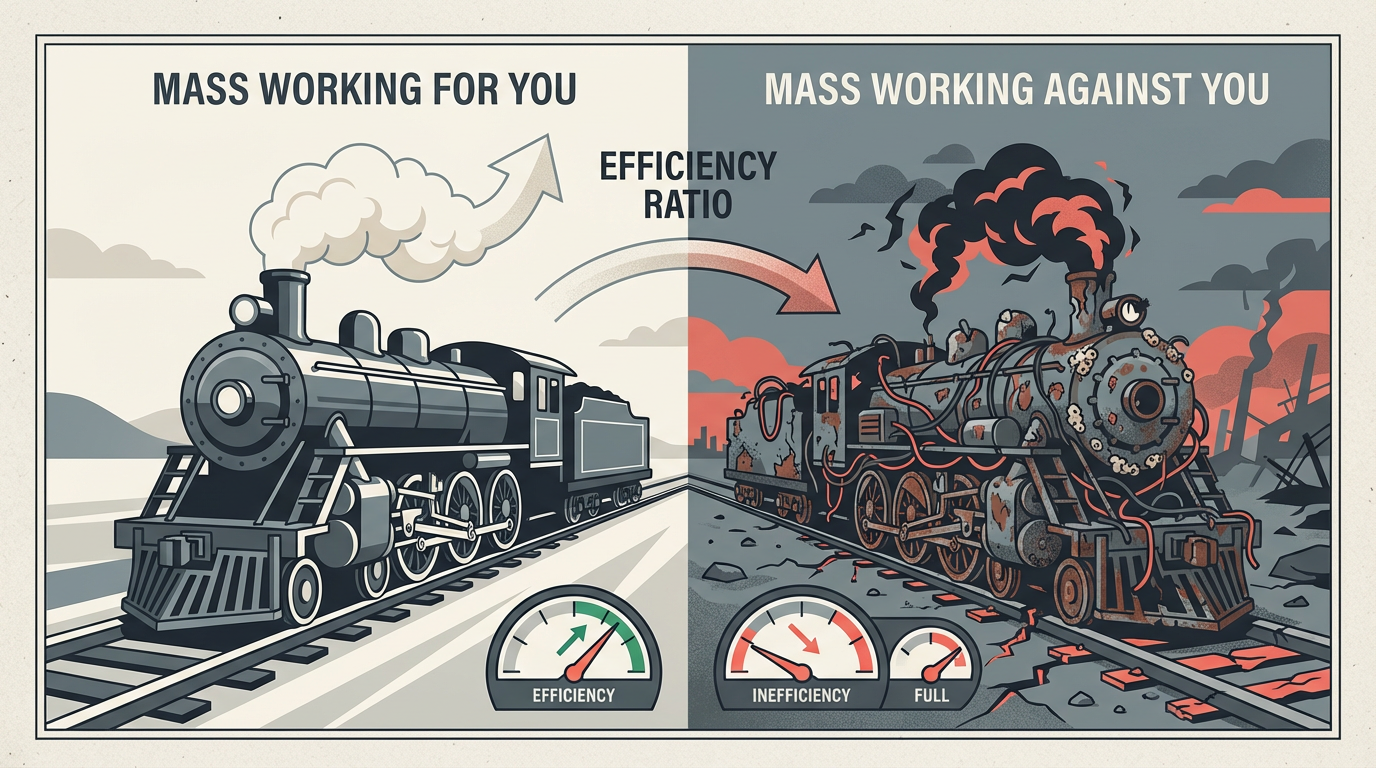
| GTM Efficiency Ratio | Total GTM spend as % of new ARR; trend over time should improve as mass compounds | Quarterly; board-level |
| Channel ROI by Maturity | Return per channel segmented by established vs. emerging; identifies diminishing returns and investment cases | Quarterly review |
| Segment Expansion Rate | Revenue and pipeline growth from adjacent ICP segments beyond the original beachhead | Quarterly; tracks growth ceiling |
| Brand-Sourced Pipeline % | % of pipeline from inbound, direct, or organic channels attributable to brand presence rather than paid acquisition | Monthly; trend matters most |
| Net Revenue Retention | Expansion + renewal minus churn from installed base; the clearest measure of product-market depth at scale | Monthly; board-level |
| Competitive Win Rate | Win rate in deals with a named competitor present; tracked by segment and competitor | Quarterly; requires CRM discipline |
| GTM Velocity Ratio | Pipeline velocity relative to team size and spend; measures whether scaling produces proportional or diminishing returns | Quarterly; flags scaling drag |
At this stage, the physics question isn’t whether the system can produce results—it clearly can. The question is whether the system is getting heavier faster than it’s getting stronger. GTM Efficiency Ratio and GTM Velocity Ratio are the two metrics that answer that directly. If both are trending favorably, the mass is working in your favor. If efficiency is degrading while velocity stalls, you’ve got a system that’s accumulating weight without accumulating power—and that’s a structural problem no amount of pipeline activity will solve.
The Physics Don’t Stop at Series C
From late-stage through IPO and beyond, the variables keep shifting. Mass continues to grow, but the composition changes—brand equity, installed base, and market expectations all become heavier, and the system becomes harder to redirect. Strategic pivots that were possible at Series B become enormously expensive. Surface area expands into new dimensions: international markets, new product lines, partner ecosystems, analyst and investor relations. Each new lever adds control but also adds complexity—more channels to maintain, more stakeholders to coordinate, more signals to parse.
Distance transforms entirely. Pre-IPO, the target shifts from repeatable revenue to provable unit economics and growth predictability that satisfy public market scrutiny. Post-IPO, the distance metric resets to quarterly expectations set by analysts and investors—a cadence the GTM engine was never originally built for. The mass that carried you through growth stages can become inertia if the system isn’t continually re-tuned for each new definition of what “self-sustaining” means.
How to Actually Use This
If you’re a founder or board member: Stage-appropriate goaling isn’t about lowering the bar. It’s about measuring the variables that actually predict future revenue at each phase. You can pressure-test your assumptions with the revenue calculator before your next board meeting. If your Series A GTM team is producing a clear, accelerating signal on ICP fit and channel viability, that’s a team building a foundation. If they’re producing a vanity pipeline against an unvalidated ICP, that’s activity masquerading as progress—and no amount of leader replacement will fix it. Use the tables above as a starting point for the conversation, not a ceiling.
If you’re a GTM leader: Negotiate these expectations before you accept the role. Walk into the interview with a stage-appropriate view of what you’ll measure and why—and how long it will take to instrument. Show the board that you understand the difference between momentum toward repeatable revenue and premature revenue theater. A founder who sees that you know how to set goals that match the system’s actual physics is a founder who will give you the time to deliver—and trust what you report back.
For both: The real prize isn’t just longer tenure. It’s alignment. When GTM leaders and the board are oriented around the same stage-appropriate metrics—when growth, sales, and leadership are reading the same instrument panel—they stop finger-pointing and start solving the actual problem. That shared understanding is what turns a revolving door into a GTM engine.
This is the companion piece to Why Every GTM Leader You Hire Fails in the Same Way, which covers the structural diagnosis behind GTM leader churn. Together they form part of the Coherence Model framework.
Nick Talbert is a growth and GTM executive with 20+ years of experience leading growth at B2B SaaS and technology companies, including roles at companies later acquired by Amazon and AOL. He writes about go-to-market strategy at strategnik.com.